Sales Funnel Efficiency & Rep Performance Analysis
Overview
Role
Revenue Operations Analyst / Sales Strategy Lead
Objective
Analyze raw sales performance data to identify revenue leakage, optimize lead distribution, and define enablement strategies.
Context
About This Case Study: This analysis was completed in the course of my GTM Team Lead role, this is an restroactive refinement of the process I used to identify optimization opportunities and present actionable recommendations.
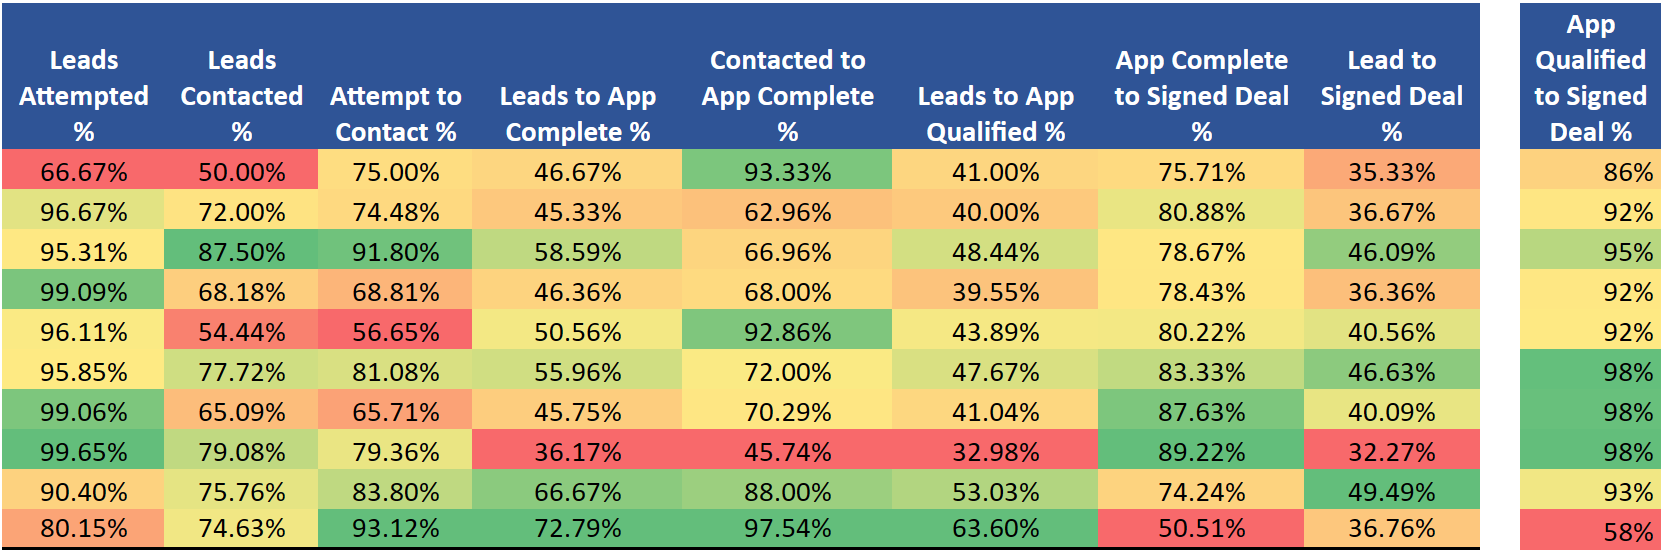
Figure 1: Sales Efficiency Heatmap Data
1. The Data Source
Before applying any strategic frameworks, I aggregated the raw performance metrics for the trailing quarter. This dataset tracks the full lifecycle from lead assignment to signed deal.
Raw Data Summary
| Rep Name | Assigned | Attempted | Contacted | App Completes | App Qualified | Signed Deals |
|---|---|---|---|---|---|---|
| Emily Jones | 300 | 200 | 150 | 140 | 123 | 106 |
| Kevin Lee | 150 | 145 | 108 | 68 | 60 | 55 |
| Jasmine Patel | 128 | 122 | 112 | 75 | 62 | 59 |
| Oliver Kim | 220 | 218 | 150 | 102 | 87 | 80 |
| Samantha Johnson | 180 | 173 | 98 | 91 | 79 | 73 |
| Daniel Wong | 193 | 185 | 150 | 108 | 92 | 90 |
| Sarah Davis | 212 | 210 | 138 | 97 | 87 | 85 |
| Michael Chen | 282 | 281 | 223 | 102 | 93 | 91 |
| Rachel Garcia | 198 | 179 | 150 | 132 | 105 | 98 |
| David Rodriguez | 272 | 218 | 203 | 198 | 173 | 100 |
| TOTAL | 2135 | 1931 | 1482 | 1113 | 961 | 837 |
2. The Analytical Framework: “Right-to-Left” Prioritization
My approach to analyzing sales data prioritizes Revenue Velocity. I analyze the funnel from Right to Left (Deal Signed \(\rightarrow\) Top of Funnel).
- Bottom of Funnel: Fix leakage closest to the revenue first (High immediate impact).
- Top of Funnel: Optimize lead utilization and activity efficiency (Long-term scalability).
Philosophy on Controllable Metrics:
When coaching reps, I prioritize metrics they can directly control. “App Completed” is more controllable than “App Qualified” because it measures persuasion and persistence—skills that can be coached. “App Qualified” depends heavily on factors outside the rep’s control: the prospect’s credit score, business financials, time in business, and market conditions.
By focusing coaching on controllable behaviors (outreach quality, objection handling, urgency creation), we increase activity and let the qualification rate settle naturally based on lead quality. Marketing and lead sourcing should optimize for qualification rates; Sales should optimize for conversion rates.
Qualification is a filtering function; completion is a persuasion function. Sales reps should be measured primarily on what they can influence through skill.
3. Key Data Observations & Performance Archetypes
Upon reviewing the rep performance heatmap, four distinct performance archetypes emerged that require different operational interventions.
Click to view the Python generation script
I wrote this script to automate the generation of these insights using Pandas and Plotly, ensuring the analysis is repeatable as data scales.
import pandas as pd
import plotly.express as px
import plotly.graph_objects as go

# 1. THE DATA
data = {
    'Rep Name': ['Emily Jones', 'Kevin Lee', 'Jasmine Patel', 'Oliver Kim', 'Samantha Johnson', 'Daniel Wong', 'Sarah Davis', 'Michael Chen', 'Rachel Garcia', 'David Rodriguez'],
    'Leads Attempted': [200, 145, 122, 218, 173, 185, 210, 281, 179, 218],
    'App Qualified': [123, 60, 62, 87, 79, 92, 87, 93, 105, 173],
    'Signed Deals': [106, 55, 59, 80, 73, 90, 85, 91, 98, 100],
    'Conversion_Rate': [35.3, 36.7, 46.1, 36.4, 40.6, 46.6, 40.1, 32.3, 49.5, 36.8], # Lead to Deal
    'Win_Rate': [86, 92, 95, 92, 92, 98, 98, 98, 93, 58] # Qual to Deal
}

df = pd.DataFrame(data)

# 2. CHART A: The "Performance Quadrant" (Scatter Plot)
# X = Volume (Leads Attempted), Y = Efficiency (Conversion Rate)
fig_scatter = px.scatter(
    df,
    x="Leads Attempted",
    y="Conversion_Rate",
    text="Rep Name",
    size="Signed Deals", # Bubble size = Total Wins
    color="Win_Rate",    # Color = Deal Quality (Red = low close rate)
    color_continuous_scale="RdYlGn",
    title="Sales Efficiency: Volume vs. Conversion",
    labels={"Conversion_Rate": "Lead-to-Deal Conversion %", "Win_Rate": "Close Rate (Qual -> Deal)"},
    template="plotly_white"
)

fig_scatter.update_traces(textposition='top center')
fig_scatter.update_layout(height=600)

# Save as interactive HTML
fig_scatter.write_html("scatter_plot.html", include_plotlyjs='cdn', full_html=False)


# 3. CHART B: The "Leakage" Comparison (Funnel)
# Comparing the 'Archetypes': Emily (Efficiency) vs David (Leaky Bucket)
categories = ['Leads Attempted', 'App Qualified', 'Signed Deals']
emily_data = [200, 123, 106]
david_data = [218, 173, 100]

fig_funnel = go.Figure()

fig_funnel.add_trace(go.Funnel(
    name='Emily Jones (High Eff)',
    y=categories,
    x=emily_data,
    textinfo="value+percent initial"
))

fig_funnel.add_trace(go.Funnel(
    name='David Rodriguez (Leaky)',
    y=categories,
    x=david_data,
    textinfo="value+percent initial"
))

fig_funnel.update_layout(
    title="Funnel Leakage Comparison: The 'Sniper' vs. The 'Machine'",
    template="plotly_white",
    height=500
)

# Save as interactive HTML
fig_funnel.write_html("funnel_chart.html", include_plotlyjs='cdn', full_html=False)

print("Charts generated: scatter_plot.html and funnel_chart.html")
A. The “High-Efficiency / Low-Volume” Performer (Emily Jones)
Data: Emily attempts only 67% of assigned leads (200/300) versus a team average of 90%, but maintains elite conversion rates at every subsequent stage:
- Contact → App Complete: 93% (vs. team avg 75%)
- App Qualified → Signed: 86% (vs. team avg 87%)
Hypothesis 1 (Behavioral): Emily may be relationship-driven with long talk times and deep discovery calls. This drives exceptional conversion quality but limits throughput. She likely excels at building trust but may lack urgency in closing sequences or post-qualification follow-up.
Hypothesis 2 (Strategic): She may be pre-qualifying leads before logging attempts, working only high-confidence opportunities while allowing lower-quality leads to age in her queue.
Diagnostic Tests:
- Compare average talk time per contact vs. team average
- Measure time-to-first-attempt after lead assignment
- Review lead aging in her pipeline vs. peers
Risk: If hypothesis 2 is correct, valuable leads are stagnating. High-quality leads that Emily doesn’t prioritize could be worked by hungrier reps. If hypothesis 1 is correct, she simply needs coaching on urgency and time management—her skills are excellent.
B. The “High-Volume / Low-Conversion” Reps (Michael Chen, Sarah Davis)
Data: These reps attempt 99%+ of assigned leads but show poor mid-funnel conversion:
- Michael: 36% Lead → App Complete (vs. team avg 52%)
- Sarah: 46% Lead → App Complete (vs. team avg 52%)
However: Their App Qualified → Signed rates are elite:
- Michael: 98% (93/95 qualified apps closed)
- Sarah: 98% (85/87 qualified apps closed)
Diagnosis: “Spray and Pray” methodology. They’re burning through lead inventory rapidly with low-effort touches, filtering for “layup” deals—prospects so motivated they’ll close with minimal sales effort. Any applications they complete are nearly guaranteed to close because they’re only advancing slam-dunk opportunities.
Risk: High opportunity cost. Difficult-but-viable leads are being “scorched” by insufficient outreach. These leads could convert with proper nurturing but are being marked as dead after 2-3 cursory attempts.
Opportunity (Cross-Functional Insight): This behavior may actually identify a valuable customer segment—**high-urgency, low-complexity buyers**. Rather than forcing Michael and Sarah to adopt slower, relationship-driven approaches, consider:
- Routing Strategy: Funnel hot inbound leads to them for rapid conversion
- Product Fit: These customers may be ideal for self-service products or marketplace offerings where speed matters more than customization
- Upsell Potential: Flag their closed deals for post-sale upsell into premium products—they converted on urgency, not on relationship, which means there’s likely expansion revenue available once their immediate need is met
C. The “Leaky Bucket” (David Rodriguez)
Data: David drives massive volume into the pipeline but catastrophically fails at the final stage:
- Highest absolute app completes: 198 (next closest is Emily at 140)
- Highest absolute qualified apps: 173 (next closest is Emily at 123)
- App Qualified → Signed: 58% (100/173)
- Team average App Qualified → Signed: 87%
Diagnosis: Poor qualification discipline. David is pushing unqualified applications through the system, inflating his mid-funnel metrics while creating enormous waste at the bottom of the funnel. He’s likely being rewarded for app volume without accountability for deal quality.
Revenue Impact: If David could match Jasmine’s 95% close rate on qualified apps, he would deliver an additional 64 deals per period (173 × 0.95 - 100 = 64.35) with zero additional lead acquisition cost. This represents the single largest revenue recovery opportunity in the dataset.
Coaching Priority: Pair David with Rachel Garcia (who has both high volume AND 93% qualified-to-signed rate) to learn rigorous qualification frameworks—specifically, what questions to ask before marking an app as “qualified.”
D. The “Balanced Excellence” Performers (Rachel Garcia, Daniel Wong, Jasmine Patel)
Data: These reps show consistent, above-average performance across all funnel stages with no major bottlenecks:
- Rachel: 90% attempt rate, 76% contact rate, 88% complete rate, 93% close rate
- Daniel: 96% attempt rate, 81% contact rate, 72% complete rate, 98% close rate
- Jasmine: 95% attempt rate, 92% contact rate, 67% complete rate, 95% close rate
Diagnosis: These reps represent the behavioral template the team should be coached toward. They balance activity (high attempt rates), effectiveness (strong contact conversion), and discipline (elite closing efficiency).
Application: Use their techniques as the coaching baseline:
- Rachel’s qualification rigor (to fix David)
- Jasmine’s contact-to-complete conversion (to fix Michael/Sarah)
- Daniel’s balanced consistency (general best practices)
4. Strategic Recommendations
4.1 Immediate Process Improvements
Lead Distribution Logic Reform
Current State Diagnosis: Based on my experience as a funding manager observing similar sales environments, the data strongly suggests a self-regulated lead flow system. In these systems, reps can see available leads and claim them at will, which creates cherry-picking behavior.
Observable Pattern: High performers monitor pipeline dashboards and strategically claim leads during optimal windows (right after they come in, during business hours, from preferred industries). Lower performers work whatever remains—aged leads, off-hours inquiries, difficult industries.
This creates a performance gap that appears to be skill-based but is actually access-based. Emily’s 67% attempt rate is likely not laziness—it’s selectivity. Michael’s 99% attempt rate with poor conversion suggests he’s claiming everything indiscriminately.
Recommended Fix: Cap-and-Recycle System
- Implement maximum lead assignment caps per rep based on their demonstrated throughput
- Emily’s cap: 200 leads/period (her current attempted volume) until her attempt rate rises to 85%+
- Route Emily’s overflow leads to Daniel and Rachel (proven high-performers with capacity)
- Implement “lead aging” triggers: If a lead sits untouched for 48 hours, automatically reassign
Expected Impact:
- Reduces lead hoarding by top performers
- Ensures all leads receive timely attention
- Forces behavioral change (Emily must attempt more or lose access)
Qualification Standards Audit
Problem: David’s 58% close rate on “qualified” apps indicates a fundamental misalignment on what constitutes “qualified.”
Action Items:
- Audit David’s 73 closed-lost opportunities from qualified apps
- What commonalities exist? (Credit issues, business age, industry, decision-maker access)
- Compare against Rachel’s closed-lost deals (she has only ~7 lost deals from 105 qualified)
- Codify the difference into mandatory qualification checkpoints:
- Credit pre-screen before marking as qualified
- Decision-maker confirmation (not just “spoke to someone”)
- Budget/timeline verification
- Competitive situation assessment
Expected Impact: Reduce David’s qualified app volume by ~30%, but increase his close rate to 85%+, resulting in net positive deal flow.
4.2 Operational Enablement: Peer-Led Coaching (Pilot-Then-Scale)
Rather than team-wide training rollouts, I recommend a pilot-then-scale approach that focuses resources on the highest-impact opportunities first.
Phase 1: High-Impact Coaching Pairs (Weeks 1-4)
Pair 1: David Rodriguez (Leaky Bucket) + Rachel Garcia (Balanced Excellence)
- Focus: Qualification discipline
- Activities:
- Rachel shadows 5 of David’s qualification calls
- David shadows 5 of Rachel’s qualification calls
- Joint debrief: What questions does Rachel ask that David skips?
- Document Rachel’s qualification framework into a 1-page checklist
- Success Metric: Move David’s qualified-to-close rate from 58% to 75% (midpoint toward team average)
- Revenue Impact: +29 additional deals if successful
Pair 2: Michael Chen (High-Volume/Low-Convert) + Jasmine Patel (Elite Mid-Funnel)
- Focus: Contact-to-application conversion
- Activities:
- Compare objection-handling techniques
- Review Michael’s “dead lead” list—are they truly dead, or insufficiently worked?
- Jasmine demonstrates her follow-up cadence (likely multi-touch, multi-channel)
- Document Jasmine’s persistence framework
- Success Metric: Move Michael’s lead-to-app rate from 36% to 45% (halfway to team average)
- Revenue Impact: +25 additional apps → ~24 additional deals
Pair 3: Emily Jones + Time Management Coach (External or Manager)
- Focus: Velocity without sacrificing quality
- Activities:
- Time audit: Track Emily’s hours-per-deal vs. team average
- If talk time is excessive, coach on qualifying-out faster (“Is this a fit? If not, let’s save both our time”)
- Implement time-boxing: Max 2 hours per lead before moving to next
- Add urgency frameworks to her closing sequences
- Success Metric: Increase Emily’s attempt rate from 67% to 85% while maintaining 80%+ close rate
- Revenue Impact: +54 additional attempts → ~26 additional deals
Phase 2: Document and Scale (Weeks 5-8)
Only if Phase 1 shows measurable improvement:
- Record successful coaching sessions and create training library
- Extract specific techniques (call scripts, qualification questions, email templates, objection responses)
- Roll out to Kevin, Oliver, and Samantha through:
- Weekly recorded call reviews
- Practice sessions with successful reps
- Manager observation and feedback
Rationale for Phased Approach: This de-risks the coaching investment. We validate what actually moves the needle before committing team-wide resources, and we focus first on reps with the largest revenue recovery potential (David’s 64-deal gap >> Michael’s 25-deal gap >> Emily’s 26-deal gap).
4.3 Missing Metrics & Data Integrity
To validate these hypotheses and make fully informed recommendations, I would need access to the following data points:
Critical Missing Metrics
App Qualified to Signed Deal % (by rep) – This isolates “closing ability” from “qualification discipline”
- I calculated this manually for key reps, but it should be a standard dashboard metric
Activity Depth Metrics:
- Dials per lead before first contact – Are low contact rates due to insufficient effort or bad lead data?
- Average touches per lead before “Attempted” status – Does “Attempted” mean one dial or a full sequence?
- Channel mix breakdown – Calls vs. emails vs. SMS vs. social outreach
- Talk time per contact – Validates the Emily hypothesis (high quality/low volume)
Lead Aging Metrics:
- Time from assignment to first attempt (by rep) – Identifies hoarding behavior
- Leads older than 7 days in pipeline (by rep) – Quantifies stagnation
Cadence Adherence:
- % of leads receiving full prescribed sequence – Are reps following the playbook or freelancing?
- Time between touches – Consistency matters as much as volume
Why These Metrics Matter
“Leads Attempted” is a binary metric that masks enormous variance in effort quality. Consider:
- Rep A makes 15 dials over 3 days with personalized emails and LinkedIn touches
- Rep B makes 2 dials at 10am on a Tuesday and marks it “attempted”
Both show “1 attempted lead” in the current dashboard, but represent completely different behaviors. Without activity depth data, I’m diagnosing based on outcome patterns—which is effective but less precise than diagnosing based on actual behavior.
4.4 Expected Business Impact
Implementing these recommendations in sequence would yield:
| Initiative | Current State | Target State | Additional Deals/Period | Est. Revenue Impact* |
|---|---|---|---|---|
| David’s Closing Efficiency | 58% close | 75% close (conservative) | 29 | High |
| Michael’s Lead Utilization | 36% to app | 45% to app (conservative) | 24 | High |
| Emily’s Lead Velocity | 67% attempt | 85% attempt | 26 | Medium-High |
| Lead Distribution Optimization | Self-regulated | Cap-and-recycle | 10-15 | Medium |
| Sarah/Michael “Hot Lead” Routing | Mixed routing | Segment-specific | 5-8 | Low (but strategic) |
| TOTAL POTENTIAL | 94-102 | Very High |
Note: Revenue impact depends on average deal size, which is not provided in the dataset. If average deal value is $10K, this represents $940K-$1.02M in incremental revenue. If ADV is $50K, this represents $4.7M-$5.1M.
Assumptions:
- Based on trailing quarter data
- Assumes current lead quality and volume remain constant
- Conservative targets (moving halfway to team average, not to best-in-class)
- Does not account for compounding effects (e.g., David closing more deals → more confidence → even better performance)
5. Executive Summary
This analysis reveals that lead inefficiency, not lead volume, is the primary constraint to revenue growth.
Key Findings:
- David Rodriguez represents a 64-deal recovery opportunity through qualification discipline
- Emily Jones is an underutilized asset—elite skills but artificial volume constraints
- Michael Chen and Sarah Davis may be optimally deployed on high-urgency segments rather than general pipeline
- Self-regulated lead distribution creates access inequality that appears as skill inequality
Strategic Recommendation: By implementing territory-aware lead routing, peer-led coaching focused on the highest-impact gaps, and qualification standard reforms, this team can unlock an estimated 94-102 additional deals per quarter (~11-12% revenue increase) without additional marketing spend.
The path forward prioritizes:
- Bottom-of-funnel fixes first (David’s close rate)
- Controllable behavior changes (activity coaching for Michael/Emily)
- Process improvements that prevent future leakage (lead distribution reform)
6. Implementation Roadmap (30-60-90 Days)
Days 1-30: Discovery & Quick Wins
- Week 1: Present findings to sales leadership; gather context on territories, seasonal patterns, recent team changes
- Week 2: Shadow Emily Jones (1 full day) and Michael Chen (1 full day) to validate behavioral hypotheses
- Week 3: Launch David + Rachel coaching pilot; begin qualification audit
- Week 4: Implement lead aging alerts (48-hour reassignment triggers); collect baseline metrics for coaching pairs
Days 31-60: Process Changes & Measurement
- Week 5: Roll out Cap-and-Recycle lead distribution system
- Week 6: Review Phase 1 coaching results; document successful techniques if metrics improved
- Week 7: Begin Phase 2 rollout to Kevin, Oliver, Samantha (if Phase 1 successful)
- Week 8: Add “App Qualified → Signed %” to weekly dashboards; establish rep-specific improvement targets
Days 61-90: Scale & Optimize
- Week 9-10: Scale successful coaching practices team-wide through recorded sessions and practice reviews
- Week 11: Adjust lead routing rules based on 60-day performance data
- Week 12: Present 90-day results to leadership; refine targets for next quarter; identify new optimization opportunities
Success Criteria:
- David’s close rate: 58% → 75%+
- Michael’s lead-to-app: 36% → 45%+
- Emily’s attempt rate: 67% → 85%+
- Team total deals: 837/quarter → 930+/quarter (+11%)
- Solving the “Blurry Line” Problem: Engineering a Python CLI for E-Ink Devices :python:open_source:tooling:automation:ci_cd:
:EXPORT_HUGO_SECTION: posts :EXPORT_FILE_NAME: eink-template-gen :EXPORT_DATE: 2025-12-04 :EXPORT_HUGO_CATEGORIES: “Project”
Introduction
I love my Supernote Manta. It’s a fantastic e-ink writing tablet. But like many e-ink devices (reMarkable, Boox), it suffers from a specific hardware constraint: no sub-pixel anti-aliasing. If you take a standard PDF template —say, a ruled notebook page generated by a generic tool— and load it onto the device, the lines often look gray, fuzzy, or inconsistent. This happens because the lines land on fractional pixel coordinates (e.g., \(y = 10.4\)), forcing the display controller to dither the pixels. On a crisp 300 DPI e-ink screen, this blur is immediately noticeable and reduces the “paper-like” contrast. I spent the last few weeks building eink-template-gen, a robust Python CLI tool designed to solve this exact problem using pixel-perfect integer math.
The Challenge: The “Half-Pixel” Problem
Standard graphic design tools operate in vector space (infinite resolution) or floating-point coordinates. When you ask for lines spaced exactly “6mm” apart, the software calculates the position mathematically:
dpi = 300
mm_to_px = 300 / 25.4  # ~11.81 px/mm
y_pos = 6 * mm_to_px   # 70.866 px
To a printer, \(70.866\) is fine. To an e-ink screen, that \(0.866\) results in aliasing. The line isn’t black; it’s a smear of gray pixels trying to represent a fraction. My goal was to build a generator that respects the hardware reality of ANY e-ink device.
The Solution: Architecture Overview
I architected the application with three core layers:
- Hardware Abstraction: A data-driven definition of device constraints.
- The Math Layer: Utilities to snap floating-point requests to integer grids.
- The Logic Layer: A registry-based system for template rendering.
Tech Stack:** Python 3.13, PyCairo (for rendering), Pytest, GitHub Actions.
Hardware Abstraction (Data-Driven Design)
I didn’t want to hardcode screen resolutions into Python classes. Instead, I implemented a data-driven approach where devices are defined in a simple JSON file. This makes the tool device-agnostic and extensible without code changes; users can add support for new devices just by editing a config file.
// src/eink_template_gen/devices.json
[
  {
    "id": "manta",
    "width": 1920,
    "height": 2560,
    "dpi": 300,
    "name": "Supernote Manta",
    "default_margin_mm": 10
  },
  {
    "id": "a5x",
    "width": 1404,
    "height": 1872,
    "dpi": 226,
    "name": "Supernote A5 X"
  }
]
The “Pixel Snapping” Algorithm
This is the heart of the engine. When a user requests “6mm spacing,” the tool doesn’t just draw lines every 6mm. It performs a “snap-and-recalculate” operation:
- Convert requested MM to Pixels.
- Round to the nearest whole integer pixel.
- Convert that integer back to MM for reporting.
- Recalculate the total page margins to ensure the grid is perfectly centered.
Here is the core logic from src/eink_template_gen/utils.py:
def snap_spacing_to_clean_pixels(spacing_mm, dpi, tolerance_mm=0.5):
    """
    Adjust spacing to nearest value that produces integer pixels
    """
    mm2px = dpi / 25.4
    ideal_px = spacing_mm * mm2px

    # Try rounding to nearest integer
    rounded_px = round(ideal_px)
    adjusted_mm = rounded_px / mm2px

    # Check if adjustment is within tolerance
    adjustment = abs(adjusted_mm - spacing_mm)

    if adjustment <= tolerance_mm:
        return adjusted_mm, float(rounded_px), adjustment > 0.001
    else:
        # Keep original if adjustment would be too large
        return spacing_mm, ideal_px, False
This ensures that if you ask for a grid, every single line lands on an exact pixel coordinate, rendering as pure black (0x00) rather than dithered gray.
Advanced Geometry: Solving the “Half-Cell” Issue
Solving the blurry line problem was only step one. The second major issue with generic generators is grid misalignment. If your device screen height is 1872 pixels, and your grid spacing is 71 pixels, you can fit 26.36 squares vertically. Most generators simply start at the top margin and draw until they hit the bottom, resulting in an ugly, cut-off “half-cell” at the bottom of the page. Even worse, if you use thicker “major lines” (e.g., every 5 squares), the page might end abruptly before completing a major section. I extended the math layer to treat margins not as fluid buffers instead of fixed boundaries. The tool calculates exactly how many complete cells (or major blocks) can fit within the safe area. It then takes the leftover space and distributes it evenly to the top and bottom or left and right margins.
def calculate_major_aligned_margins(content_dimension, spacing_px, base_margin, major_every):
    """
    Calculate margins that force grid to end on major lines
    """
    major_unit_px = major_every * spacing_px

    # How many full major blocks fit?
    num_complete_units = int(content_dimension / major_unit_px)

    # How much space is actually needed?
    needed_space = num_complete_units * major_unit_px

    # Calculate the leftover space
    leftover_space = content_dimension - needed_space

    # Distribute leftover space to margins
    start_addition = int(leftover_space / 2)
    end_addition = int(leftover_space - start_addition)

    return (base_margin + start_addition, base_margin + end_addition)
By calculating the layout “inside-out”—determining content first, then margins—the tool guarantees that every grid ends perfectly on a line. The result is a visually balanced page that feels like it was natively designed for the device.
Escape Hatches: Designing for Diverse Workflows
While “pixel-perfect” is the default opinion of this tool, I recognized that software engineering requires handling edge cases where the default opinion is wrong. I implemented “escape hatches” for users who prioritize physical accuracy over visual crispness.
1. The “True Scale” Flag
Engineers or architects might need a grid where “5mm” means exactly 5.000mm, because they are scaling physical drawings on the screen. For them, pixel snapping is a bug, not a feature.
I added the --true-scale flag, which bypasses the integer rounding logic entirely. It accepts the anti-aliasing blur in exchange for dimensional precision.
2. Enforcing Margins
Sometimes, a user wants a strict margin for printing, specific toolbar clearance or just a consistent presentation across pages and therefor wouldn’t want the “fluid buffer” adjustment I described above.
The --enforce-margins flag locks the margins to the user’s input, forcing the grid to cut off if necessary.
This flexibility ensures the tool serves both the aesthetic perfectionist and the technical pragmatist.
The Registry Pattern (Open/Closed Principle)
To support a growing library of templates (Lined, Grid, Dotgrid, Music Staves, Isometric, etc.) without turning main.py into a spaghetti-code nightmare, I used the Registry Pattern.
New templates can be added by defining a draw function and registering it in src/eink_template_gen/templates.py. The rest of the application (CLI, Wizard, JSON engine) automatically discovers the new capability.
TEMPLATE_REGISTRY = {
    "lined": {
        "draw_func": drawing.draw_lined_section,
        "decorations": ["line_numbers"],
        "specific_args_map": {
            "line_width_px": "line_width",
            "major_every": "major_every",
        },
    },
    "isometric": {
        "draw_func": drawing.draw_isometric_grid,
        "decorations": [],
        "specific_args_map": { ... },
    },
    # Adding a new template only requires adding an entry here
}
I used this same pattern for the implementation of Cover pages and Divider lines.
User Experience: The State Machine Wizard
While CLI flags are powerful (`eink-template-gen grid –spacing 5mm`), they are intimidating for non-technical users. I wanted this tool to be accessible to the general Supernote community.
I implemented an interactive “Wizard” (src/eink_template_gen/wizard.py) using a State Machine approach. Instead of a linear script of `input()` calls, the wizard advances through discrete states (`_select_device`, `_select_template_type`, `_configure_spacing`).
This architecture allows for complex navigation logic, such as:
- Conditional Branches: If the user selects “Multi-Grid,” ask for Rows/Columns. If “Lined,” ask for Line Numbers.
- “Back” Functionality: Users can type ‘b’ at any prompt to return to the previous state without restarting the script.
def run(self):
    steps = [
        self._select_device,
        self._select_template_type,
        self._configure_spacing,
        # ...
    ]
    current_step = 0

    while 0 <= current_step < len(steps):
        step_function = steps[current_step]
        result = step_function()

        if result == "back":
            current_step -= 1
        elif result == "next":
            current_step += 1
Parametric Design: Templates as Code
In the DevOps world, we rarely configure servers manually; we define the desired state in code (IaC) and let an engine build it. I applied this same “Configuration as Code” philosophy to graphic design. Instead of forcing users to manually draw complex layouts, I built a parametric JSON engine. Users define a “manifest” describing the page structure—ratios, regions, and styles—and the tool renders it deterministically.
For example, a user can define a “Cornell Notes” layout structurally, without ever touching a drawing tool:
// examples/json_layouts/cornell_notes.json
{
  "device": "manta",
  "master_spacing_mm": 7,
  "page_layout": [
    {
      "name": "Cue Column",
      "region_rect": [0, 0.12, 0.25, 0.68], // x, y, width, height (percentages)
      "template": "lined",
      "kwargs": { "line_width_px": 0.5 }
    },
    {
      "name": "Summary Footer",
      "region_rect": [0, 0.8, 1.0, 0.2],
      "template": "grid",
      "kwargs": { "major_every": 5 }
    }
  ]
}
This approach decouples the definition of the template from its rendering. It allows users to version-control their notebook layouts just like they would version-control a Kubernetes manifest.
Algorithmic Art: L-Systems & Truchet Tiles
Beyond utility templates, I wanted users to leverage the capabilities of high-res e-ink for personalization and intimacy. I implemented several generative algorithms for cover pages and divider lines:
- Truchet Tiles: Uses randomized rotations of simple arc/line tiles to create complex, maze-like patterns.
- L-Systems (Fractals): I implemented a string-rewriting engine to generate fractals like the Hilbert Curve and Koch Snowflake.
The L-System engine (src/eink_template_gen/lsystem.py) generates a command string based on axioms and rules, which is then interpreted by a “turtle” renderer in PyCairo.
L_SYSTEM_DEFINITIONS = {
    "hilbert_curve": {
        "axiom": "A",
        "rules": {"A": "+BF-AFA-FB+", "B": "-AF+BFB+FA-"},
        "angle": 90,
    }
}
Engineering for Reliability
This isn’t just a script; it’s a software product. I ensured reliability through:
- Automated Testing: A comprehensive `pytest` suite covering everything from the math utilities to the CLI argument parsing.
- CI/CD Pipeline: A GitHub Actions workflow (`ci.yml`) runs linting (Ruff/Black) and executes tests across a matrix of Python versions (3.8, 3.11) to ensure backward compatibility and robust environment management.
- Automated Publishing: Releases are automatically built and pushed to PyPI when a new Release is created in GitHub (`publish.yml`).
Conclusion
Visual artifacts on e-ink screens are a small annoyance, but fixing them required a deep dive into coordinate geometry and careful software architecture. By respecting the hardware limitations and building a flexible, data-driven architecture, eink-template-gen provides a tool that is both powerful for developers and accessible for users.
You can check out the code or install the tool yourself:
- GitHub: calebc42/eink-template-gen
- PyPI:
pip install eink-template-gen
“The details are not the details. They make the design.” – Charles Eames